Chapter 6 PRO-Analysis
6.1 QC
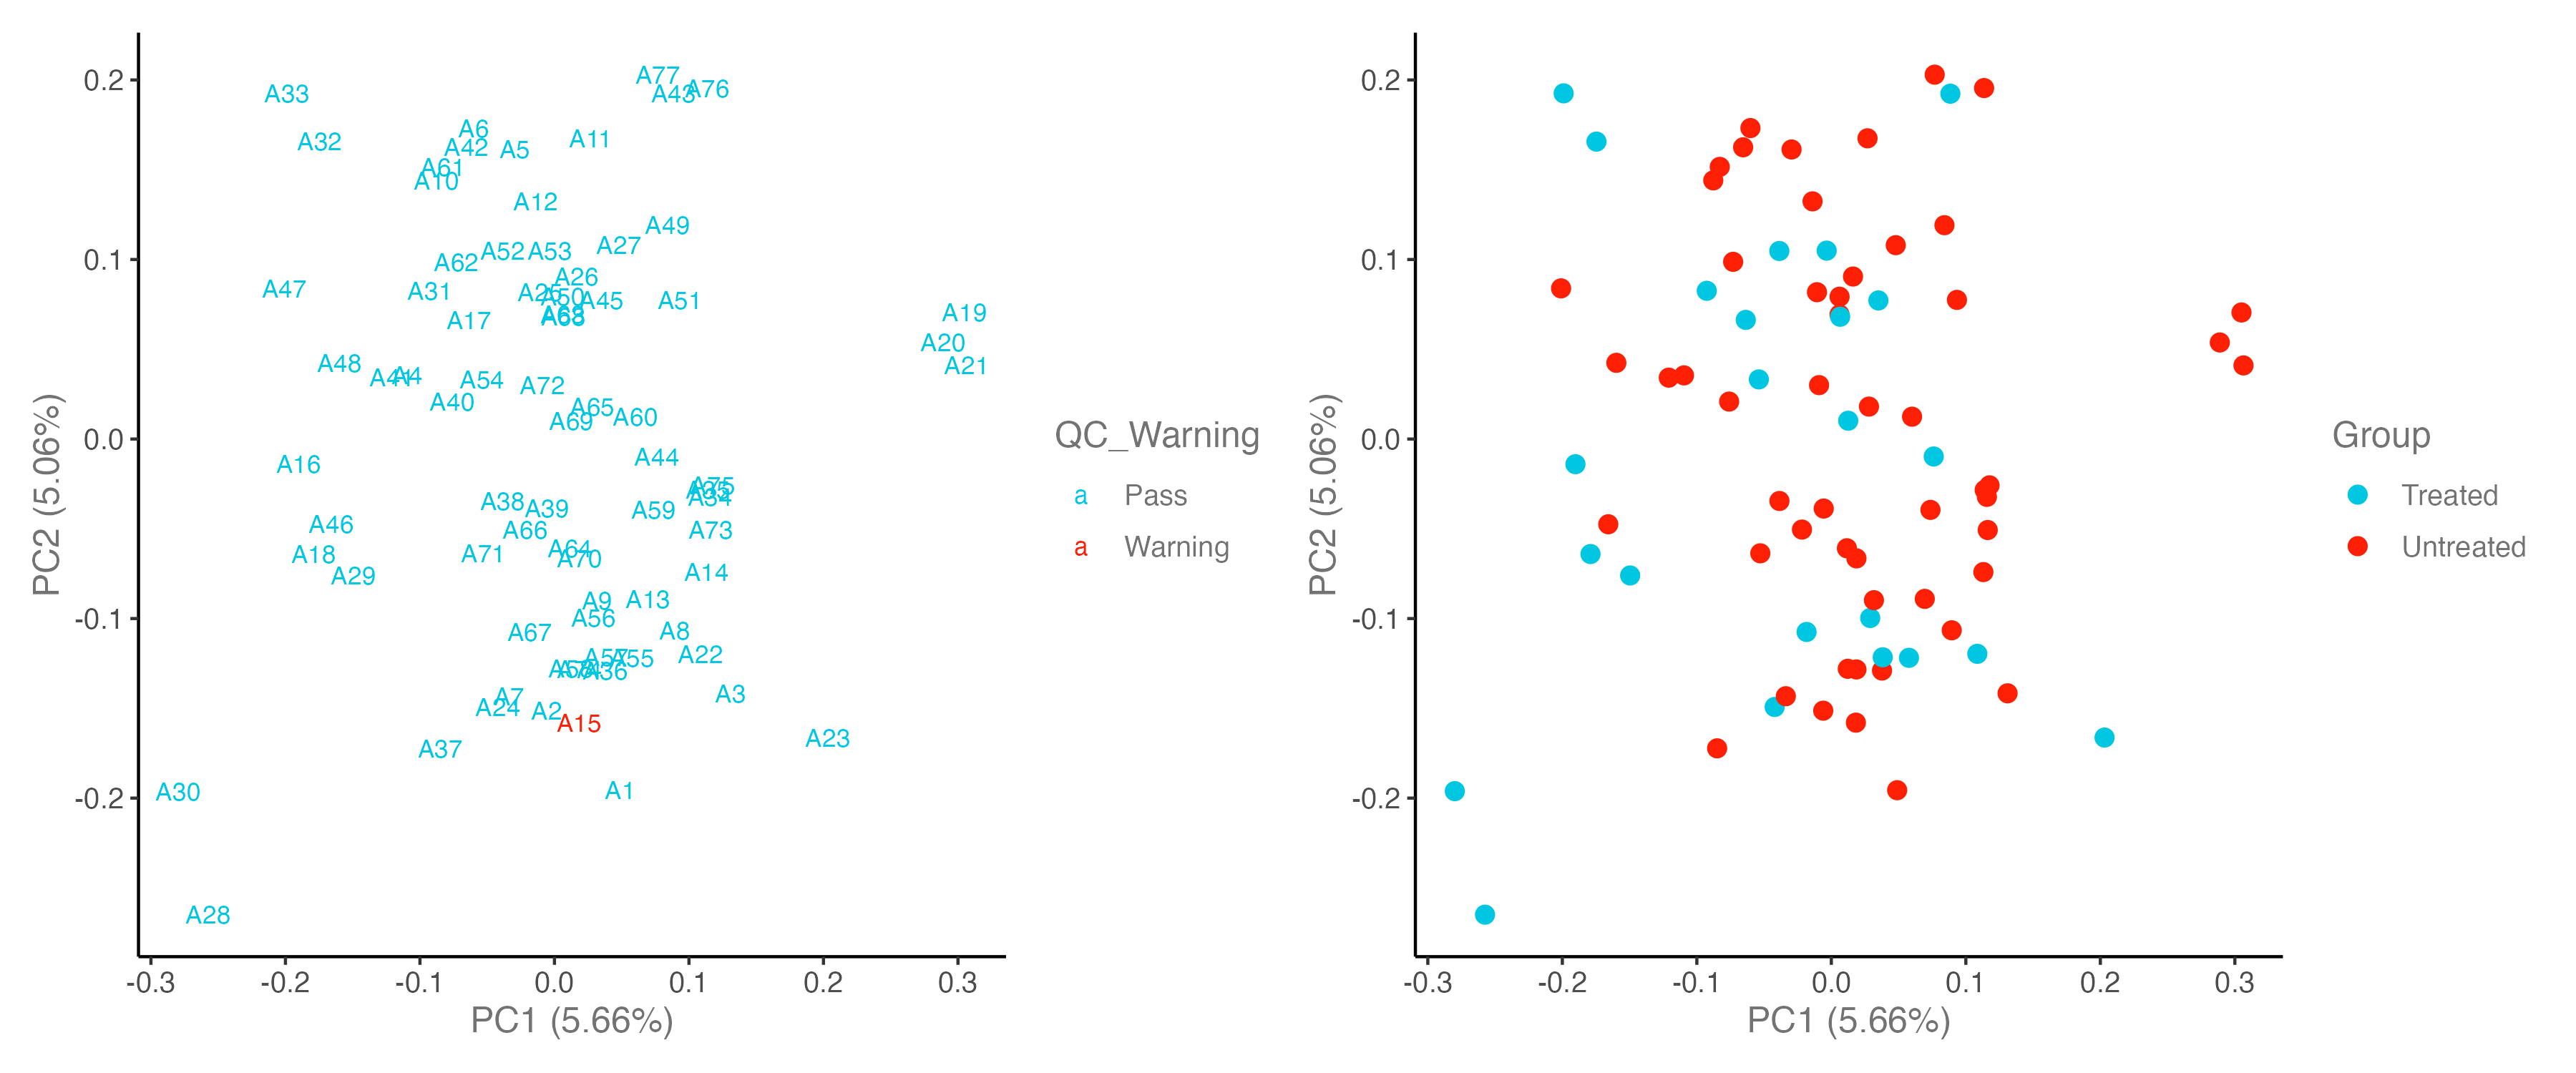
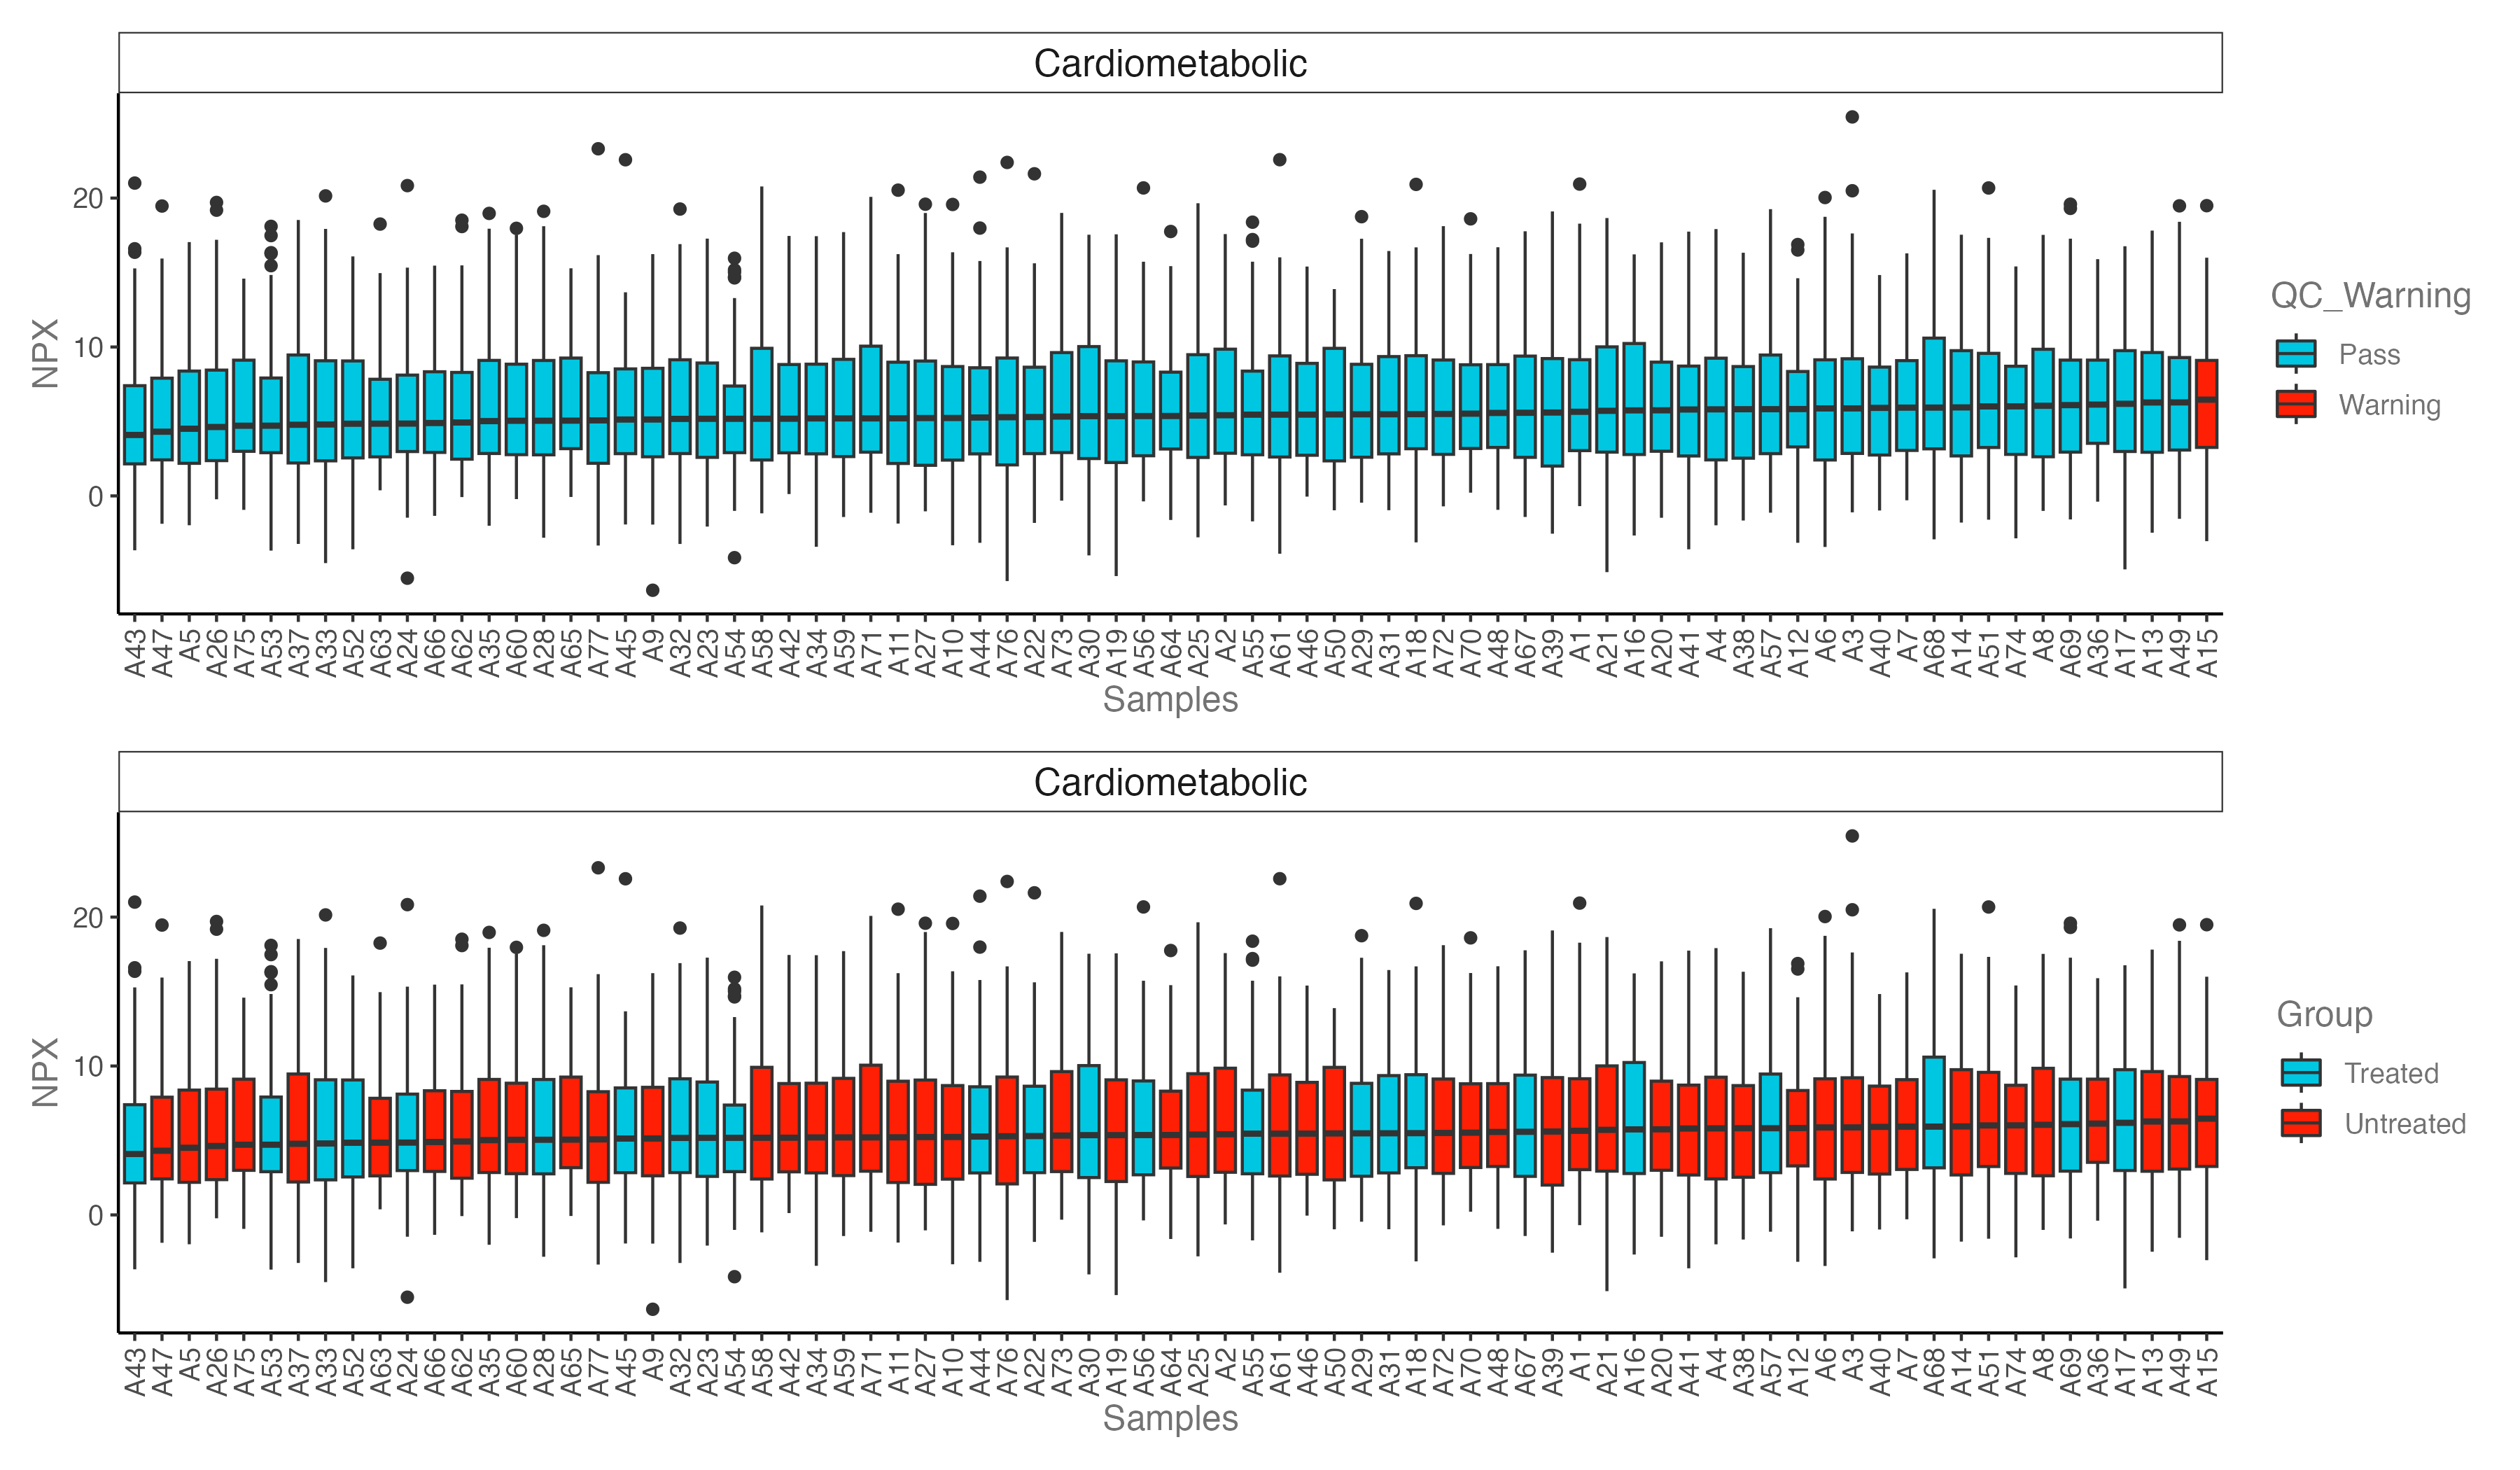
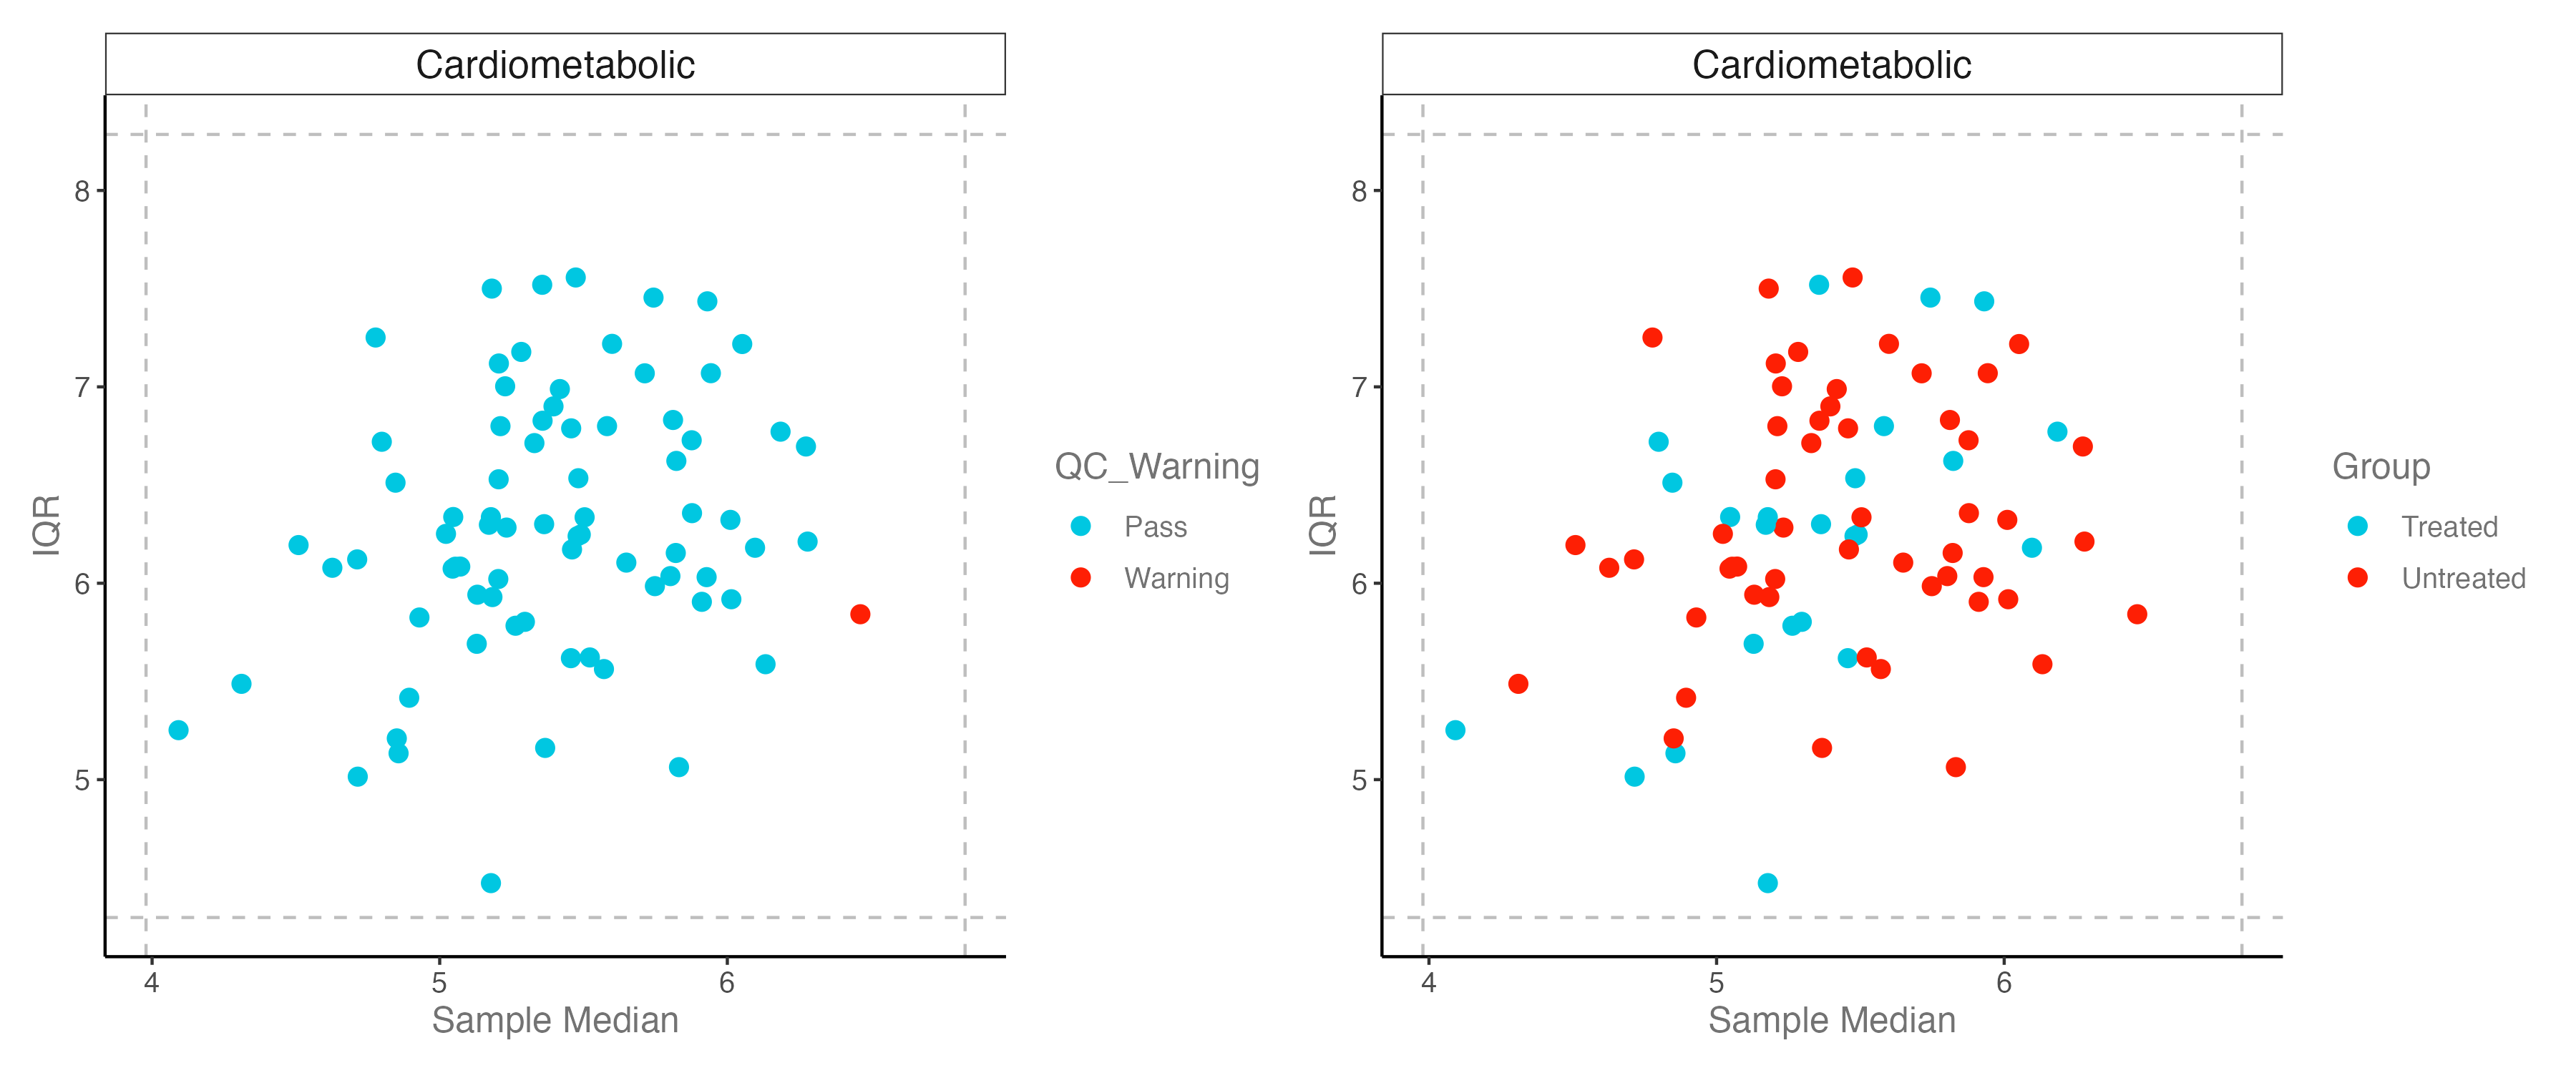
- If a sample is an outlier in the PCA, NPX distribution, and QC plots, that this might indicate a true outlier.
library(OlinkAnalyze)
library(tidyverse)
library(openxlsx)
library(patchwork)
dir.create("./results/PRO",recursive = T)
#----------------------------------------------------------------------------------
#  Step 1: Load clean Olink data
#----------------------------------------------------------------------------------
dat_clean <- readRDS("./data/20231123_olink_long.rds") %>% as_tibble()
 #   SampleID       Index OlinkID UniProt Assay MissingFreq Panel_Version PlateID QC_Warning   LOD   NPX
 #   <chr>          <int> <chr>   <chr>   <chr>       <dbl> <chr>         <chr>   <chr>      <dbl> <dbl>
 # 1 A1                 1 OID012… O00533  CHL1       0.0188 v.1201        Exampl… Pass        2.37 13.0
 # 2 A2                 2 OID012… O00533  CHL1       0.0188 v.1201        Exampl… Pass        2.37 11.3
 # 3 A3                 3 OID012… O00533  CHL1       0.0188 v.1201        Exampl… Pass        2.37 25.5
 # 4 A4                 4 OID012… O00533  CHL1       0.0188 v.1201        Exampl… Pass        2.37 14.5
 # 5 A5                 5 OID012… O00533  CHL1       0.0188 v.1201        Exampl… Pass        2.37  7.63
 # 6 A6                 6 OID012… O00533  CHL1       0.0188 v.1201        Exampl… Pass        2.37  6.32
#----------------------------------------------------------------------------------
#  Step 2: PCA plot: check QC_Warning samples & Group
#----------------------------------------------------------------------------------
p1 <- dat_clean %>% olink_pca_plot(label_samples = T, quiet = T)
p2 <- dat_clean %>% olink_pca_plot(color_g = "Group", quiet = T)
p <- p1[[1]] + p2[[1]]
ggsave("./results/PRO/1.PCA_QC.png", p, width = 12, height = 5)
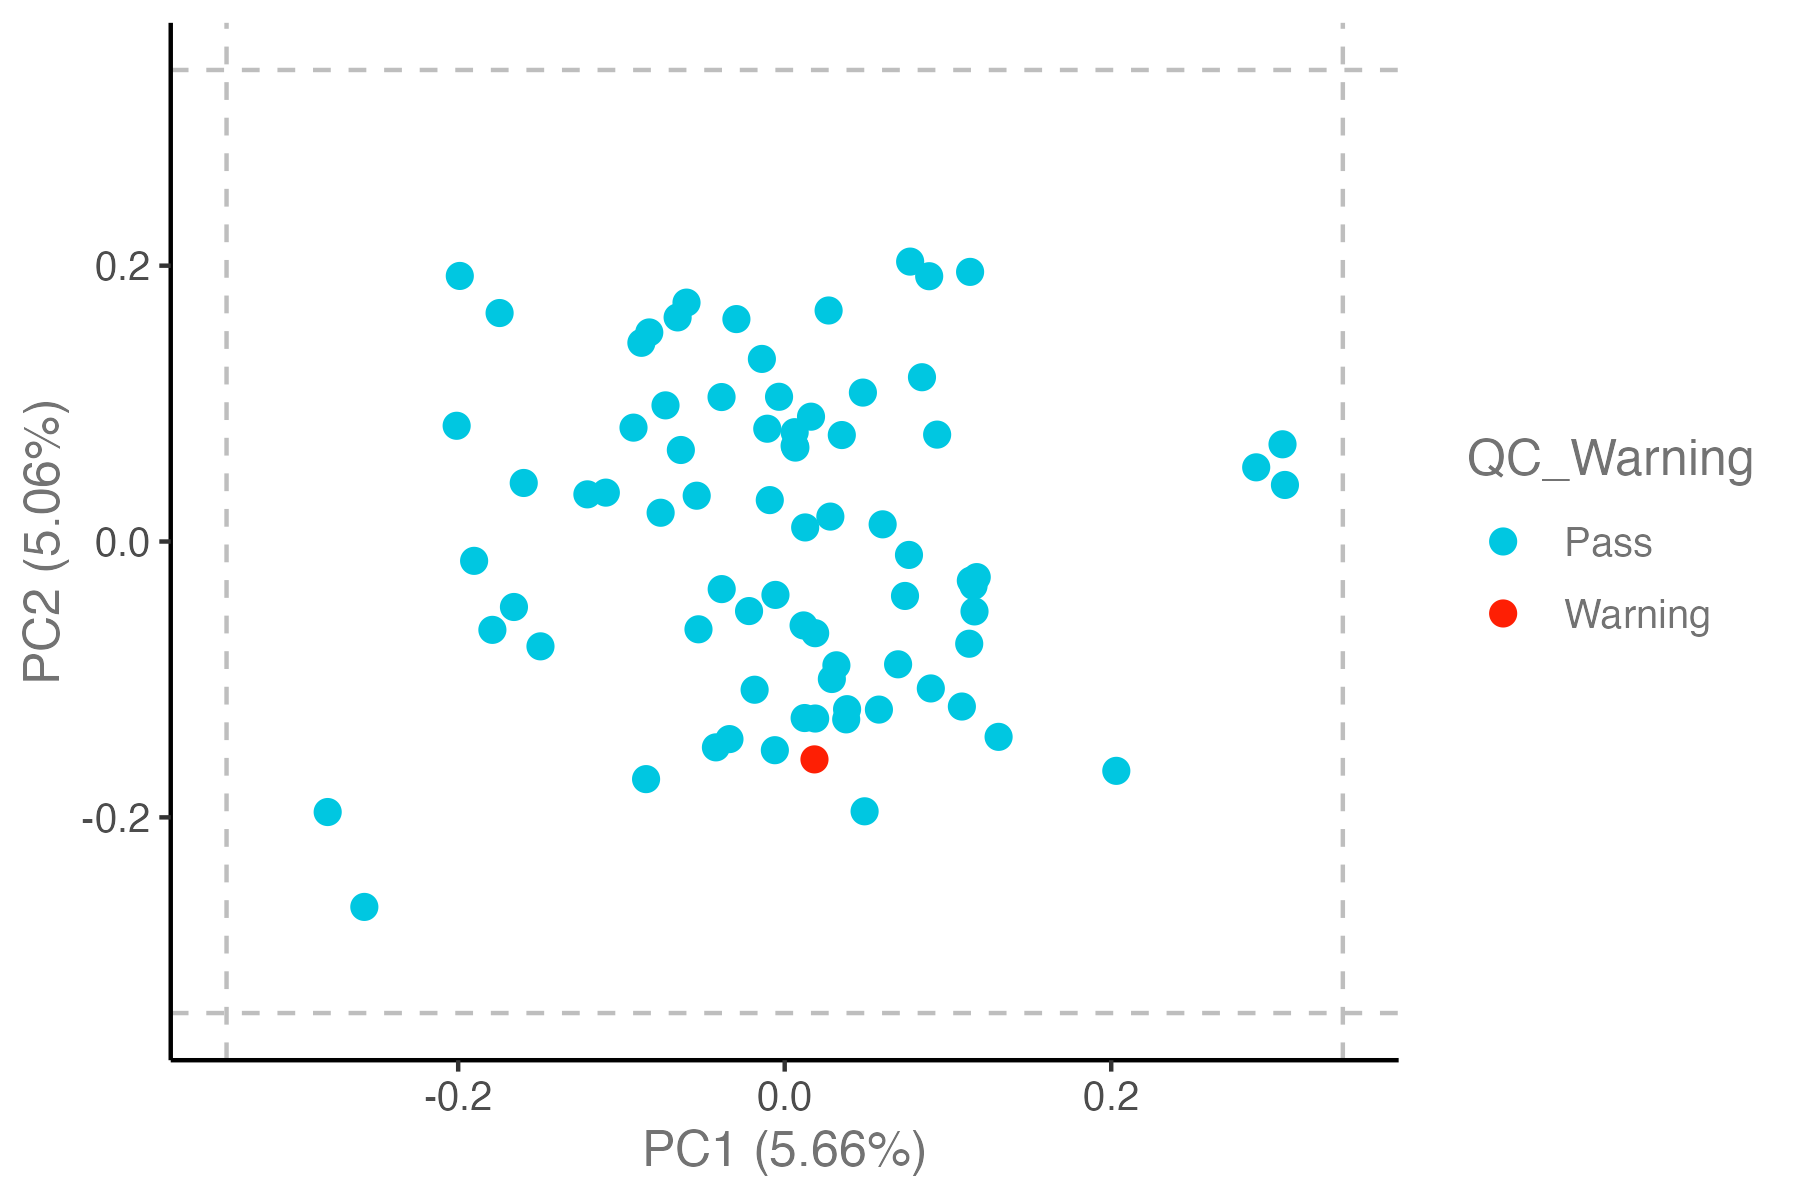
## PCA plot: 3 SD from the mean of the plotted PC
# Samples more than +/-outlierDef[3,3] standard deviations from the mean of the plotted PC will be labelled.
p <- dat_clean %>% olink_pca_plot(outlierDefX = 3, outlierDefY = 3, outlierLines = T, label_outliers = T, quiet = T)
ggsave("./results/PRO/1.PCA_QC_outlierDef_3sd.png", p[[1]], width = 6, height = 4)
#----------------------------------------------------------------------------------
#  Step 3: Boxplot: NPX distribution plot
#----------------------------------------------------------------------------------
p1 <- dat_clean %>% olink_dist_plot() +
  theme(axis.text.x = element_text(angle = 90, hjust = 1, vjust = 0.5))
p2 <- dat_clean %>% olink_dist_plot(color_g = "Group") +
  theme(axis.text.x = element_text(angle = 90, hjust = 1, vjust = 0.5))
p <- p1 + p2 + plot_layout(ncol = 1)
ggsave("./results/PRO/2.Box_distribution.png", p, width = 12, height = 7)
#----------------------------------------------------------------------------------
#  Step 4: QC plot: IQR_median
#----------------------------------------------------------------------------------
# IQR: interquartile range, 四分位距
# dashed lines: +/-3 standard deviations
p1 <- dat_clean %>% olink_qc_plot()
p2 <- dat_clean %>% olink_qc_plot(color_g = "Group")
p <- p1 + p2
ggsave("./results/PRO/3.IQR_qc.png", p, width = 12, height = 5)
-注:是否应排除这些异常值取决于潜在异常值与其他样本的不同程度,以及异常值是否可以追溯到生物学、样本特定或技术问题。综合上述几个分析,本测试数据的QC_Warning样本予以保留。
6.2 Differential Protein Expression Analysis
library(rstatix)
#----------------------------------------------------------------------------------
#  Step 1: Basic statistical analysis on clinical data: Age & Gender
#----------------------------------------------------------------------------------
dat_clean %>%  dplyr::select(Group, Gender) %>% table() %>% chisq_test() ## 性别在分组之间有显著差异,需要进行矫正
#       n statistic        p    df method          p.signif
# * <int>     <dbl>    <dbl> <int> <chr>           <chr>
# 1  7084      261. 1.24e-58     1 Chi-square test ****
dat_clean %>% t_test( Age ~ Group , detailed = T)
#   estimate estimate1 estimate2 .y.   group1  group2    n1    n2 statistic     p    df conf.low conf.high
# *    <dbl>     <dbl>     <dbl> <chr> <chr>   <chr>  <int> <int>     <dbl> <dbl> <dbl>    <dbl>     <dbl>
# 1    0.227      79.2      79.0 Age   Treated Untre…  2208  4876     0.692 0.489 4007.   -0.416     0.871
#----------------------------------------------------------------------------------
#  Step 2: T test, no adjustment
#----------------------------------------------------------------------------------
# perform t-test
dat_clean <- dat_clean %>% mutate(Group = factor(Group,levels=c("Treated","Untreated")))
ttest_results <- olink_ttest(df = dat_clean, variable = "Group")
# cutoff: adj.P.Val < 0.05 && |FC| > 1.5
ttest_results <- ttest_results %>%
  dplyr::rename("log2FC" = "estimate") %>%
  mutate(Group = case_when( Adjusted_pval<0.05&log2FC>0.58 ~ "up",
                            Adjusted_pval<0.05&log2FC< -0.58 ~ "down",
                            .default = "not sig"))
# output
write.xlsx(ttest_results, file = "./results/PRO/4.deps_ttest_results.xlsx")
table(ttest_results$Group)- Olink deps results (no adjustment): 4.deps_ttest_results.xlsx
#----------------------------------------------------------------------------------
#  Step 3:  limma, adjusted by Gender
#----------------------------------------------------------------------------------
library(limma)
# data: wide format
exp <- readRDS("./data/20231123_olink_wide.rds")
meta <- readRDS("./data/20231123_olink_meta.rds")
identical(rownames(meta),colnames(exp))
# limma
meta$contrast <- as.factor(meta$Group)
design    <- model.matrix(~ 0 + contrast + Gender  , data = meta)
fit       <- lmFit(exp, design)
contrast  <- makeContrasts( limma_adjAge = contrastTreated - contrastUntreated ,
                            levels = design)
fits      <- contrasts.fit(fit, contrast)
ebFit     <- eBayes(fits)
# result
# KO_WT
res <- topTable(ebFit, coef = "limma_adjAge", adjust.method = 'fdr', number = Inf)
limma.res <-  res %>% filter(!is.na(adj.P.Val)) %>%
              mutate( logP = -log10(P.Value) ) %>%
              mutate( contrast = "Treated_Untreated") %>%
              mutate( logFDR = -log10(adj.P.Val) ) %>%
              mutate( GeneSymbol = rownames(res)) %>%
              dplyr::select(GeneSymbol,everything()) %>%
              as_tibble()
## cutoff: adj.P.Val < 0.05 && |FC| > 1.5
limma.res <- limma.res %>% mutate(group = case_when( adj.P.Val<0.05&logFC>0.58 ~ "up",
                                                     adj.P.Val<0.05&logFC< -0.58 ~ "down",
                                                     .default = "not sig"))
limma.res %>% count(group)
## output
write.xlsx( limma.res, "./results/PRO/5.deps_limma_adjAge_results.xlsx", overwrite = T, rowNames = F)
其他分析及可视化部分可参考RNA-seq分析